Direxion HCM Tactical Enhanced US ETF
The Direxion HCM Tactical Enhanced US ETF is actively managed and seeks to provide enhanced returns across multiple market cycles that are broadly correlated to the U.S. equity markets.
HCMT
Operational Updates
- 01/23/2024
Direxion's New ETF Alert Service. Get Price and Volume Alerts automatically via text message!
Set Up Your ETF Alerts Today
Documents & Downloads
The Fund uses a proprietary quantitative investment model based on the HCM-BuyLine® (the “Model”) developed by the Fund’s subadvisor, Howard Capital Management, Inc. (“Subadviser”), to determine if the Fund’s assets are allocated to U.S. equity securities or to cash and cash equivalents (i.e., money market funds, U.S. government securities and/or similar securities). The Fund will invest in or have exposure to, U.S. equity securities in order to achieve capital appreciation, or will invest in cash or cash equivalents in order to attempt to preserve capital during market downturns. When allocated to U.S. equities, the Fund will seek leveraged exposure of its net assets through investments in derivatives, such as swaps, in order to achieve enhanced returns.
When the Fund is allocated to U.S. equity securities, it will have approximately the following daily exposures: 80% to the S&P 500®, 80% to QQQ, and up to 40% to the Sector Allocation.** The Fund will utilize leverage to achieve total exposure of up to 200% of the Fund’s net assets to these allocations. A Sector Allocation of less than 40% may result in the Fund having less than 200% total exposure each day.
The Subadviser provides the Fund’s investment adviser, Rafferty Asset Management, LLC (“Adviser”), with investment signals (“Investing Signals”) pursuant to the Model’s determinations. The Adviser is responsible for investing the Fund’s assets pursuant to the Investing Signals and may rebalance the Fund’s portfolio as frequently as daily when invested in U.S. equity securities so that its exposure to the allocations is consistent with the Fund’s investment strategy.
Pricing & Performance
NAV and Market Price information as of 04/25/2024.
Net Asset Value (NAV)
Market Price Closing
| 1M | 3M | YTD | 1Y | 3Y | 5Y | 10Y | Since Inception | Expense Ratio* (Gross / Net%) | Inception Date | |
|---|---|---|---|---|---|---|---|---|---|---|
| HCMT NAV | 3.24 | 16.02 | 16.02 | — | — | — | — | 24.29 | 2.02 / 1.17* | 06/22/2023 |
| HCMT Market Close | 3.36 | 16.38 | 16.38 | — | — | — | — | 24.80 | 2.02 / 1.17* | 06/22/2023 |
As of March 31, 2024
*The Net Expense Ratio includes management fees, other operating expenses and Acquired Fund Fees and Expenses. If Acquired Fund Fees and Expenses were excluded, the Net Expense Ratio would be 1.15%. The Fund’s adviser, Rafferty Asset Management, LLC (“Rafferty”), has entered into an Operating Expense Limitation Agreement with the Fund. Under the Operating Expense Limitation Agreement, Rafferty has contractually agreed to waive all or a portion of its management fee and/or reimburse the Fund for Other Expenses through September 1, 2025, to the extent that the Fund’s Total Annual Fund Operating Expenses exceed 1.15% of the Fund’s average daily net assets (excluding, as applicable, among other expenses, taxes, swap financing and related costs, acquired fund fees and expenses, dividends or interest on short positions, other interest expenses, brokerage commissions and extraordinary expenses). If these expenses were included, the expense ratio would be higher.
The performance data quoted represents past performance. Past performance does not guarantee future results. The investment return and principal value of an investment will fluctuate. An investor’s shares, when redeemed, may be worth more or less than their original cost. Current performance may be lower or higher than the performance quoted. Returns for performance under one year are cumulative, not annualized. For the most recent month-end performance please visit the fund’s website at www.direxion.com.
Short-term performance, in particular, is not a good indication of the fund’s future performance, and an investment should not be made based solely on returns. Because of ongoing market volatility, fund performance may be subject to substantial short-term changes. For additional information, see the fund’s prospectus.
Advisors
Howard Capital Management, Inc. (HCM) is a SEC-Registered Investment Advisory Firm founded by Vance Howard, which offers professional money management services to private clients, financial advisors, and registered investment advisors through a suite of separately managed accounts, retirement tools, self-directed brokerage accounts, proprietary mutual funds and ETFs. HCM has $4 Billion in Assets Under Management.
The Direxion Shares ETF Trust is a registered investment company offering a number of separate exchange-traded funds. Rafferty Asset Management, LLC serves as the investment adviser to the Fund and Howard Capital Management, Inc. serves as the subadviser to the Fund.
Investing Signals
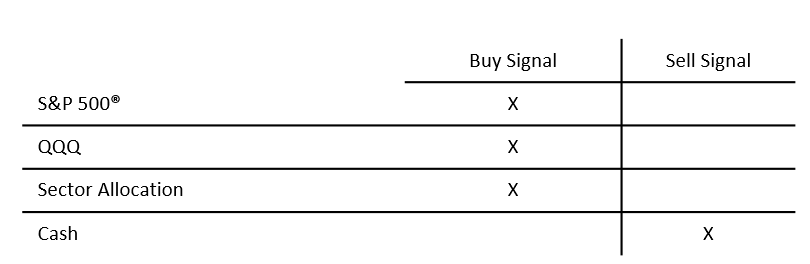
- HCM-BuyLine relies on rules based technical indicators to determine whether to invest in U.S. Equities or Cash.
- A buy signal is triggered when the S&P 500 closes above the HCM-BuyLine for a period of five consecutive days.
- When the S&P 500 closes below the HCM-BuyLine based on a pre- determined percentage threshold, a downtrend is established and the Model generates a sell signal and goes to Cash.
- When the Model generates a buy signal the Fund will allocate equally to the S&P 500 and QQQ with an additional satellite exposure to the top ranked sector or industry**
Distributions
| Record Date | Ex Date | Pay Date | Income Dividend | Short-Term Capital Gain | Long-Term Capital Gain | |
|---|---|---|---|---|---|---|
| 03/20/2024 | 03/19/2024 | 03/26/2024 | 0.05228 | — | — | |
| 12/22/2023 | 12/21/2023 | 12/29/2023 | 0.10522 | — | — | |
| 09/20/2023 | 09/19/2023 | 09/26/2023 | 0.06380 | — | — | |
Record Date03/20/2024 Ex Date03/19/2024 Pay Date03/26/2024 Income Dividend0.05228 Short-Term Capital Gain— Long-Term Capital Gain— Record Date12/22/2023 Ex Date12/21/2023 Pay Date12/29/2023 Income Dividend0.10522 Short-Term Capital Gain— Long-Term Capital Gain— Record Date09/20/2023 Ex Date09/19/2023 Pay Date09/26/2023 Income Dividend0.06380 Short-Term Capital Gain— Long-Term Capital Gain— | ||||||
**The S&P 500 Index measures the performance of 500 large capitalization companies listed on stock exchanges in the U.S. The QQQ represents all of the 100 largest, U.S.-based, non-financial companies listed on the NASDAQ Stock Exchange. The Sector Allocation is the securities of a specific sector or industry. The Sector Allocation will be in one of the following 13 sectors or industries: industrial sector, communication services sector, consumer discretionary sector, consumer staples sector, energy sector, financial sector, health care sector, real estate sector, technology sector, utilities sector, materials sector, biotechnology industry and semiconductor industry.
Documents
How to Trade
ETFs are generally available for purchase on exchanges, much like stocks—and can be bought and sold throughout the trading day whenever exchanges are open. Direxion ETFs cannot be purchased directly from Direxion, but are available for trading on most trading platforms.
We strongly recommend that you take the time to educate yourself on how leveraged and inverse ETFs function and behave in various market conditions before you endeavor to trade them in your account. It’s always a good idea to consult a financial advisor or brokerage account representative if you have questions about any ETFs.
Please note, your advisor or broker may charge commissions or other transaction fees. If you have any questions specific to Direxion products, please contact us direct at [email protected] or 866-476-7523.
Operational Updates
- 01/23/2024
Direxion's New ETF Alert Service. Get Price and Volume Alerts automatically via text message!
Set Up Your ETF Alerts Today
Documents & Downloads
How to Trade
While you can't trade our funds from our website, investors still have multiple options for buying Direxion ETFs
Learn More About Trading Direxion ETFs
Subscribe to Newsletters & Operational Updates
Sign up for email and/or text of the important news, including:
- Fund updates including splits, distributions, launches, and other corporate actions
- Educational events, such as web seminars and conferences
- Our latest research and industry trends
Learn About Leveraged & Inverse ETFs
Trading is different than investing. Use our insights and educational resources to make sure you’re ready to trade in Direxion’s Leveraged and Inverse ETFs.

Leveraged and Inverse ETF Education Center

The Xchange Newsletter